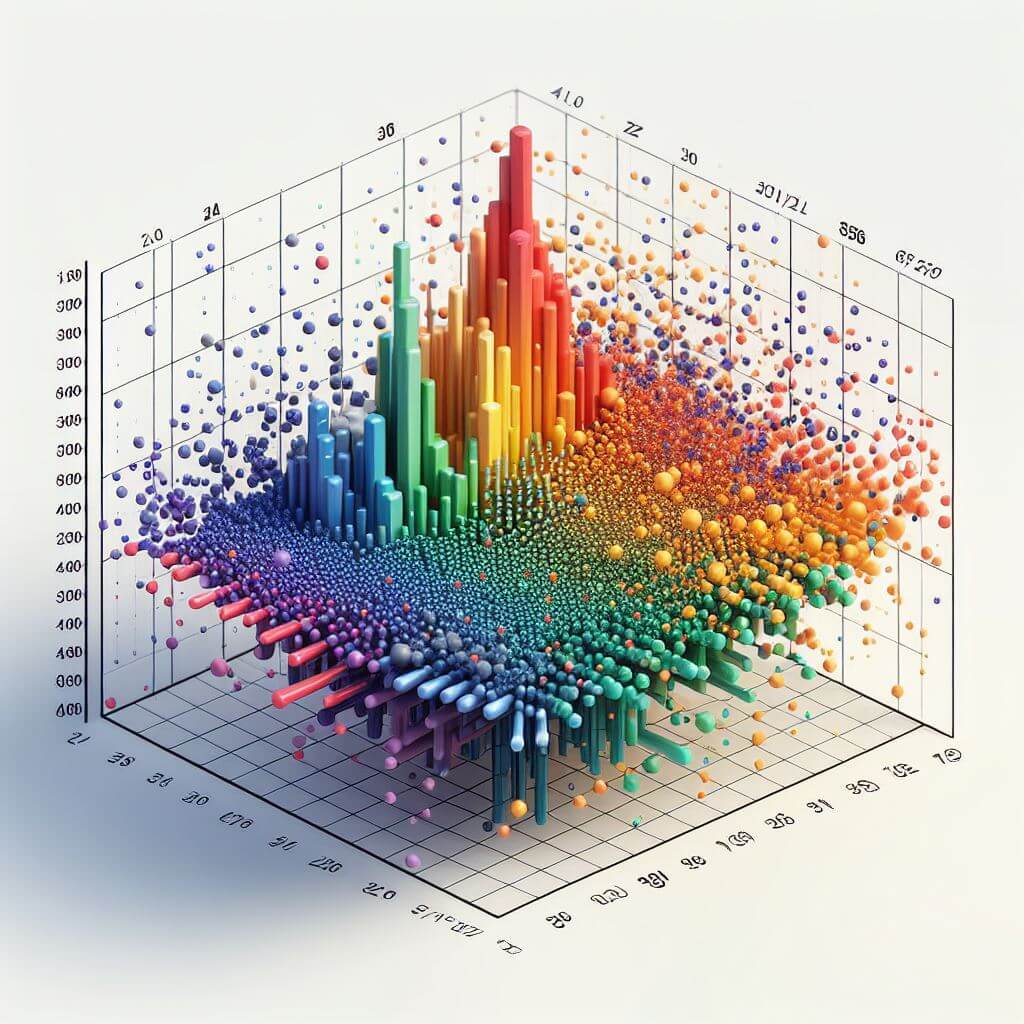
At its most fundamental level, Principal Component Analysis (PCA) serves as one of the quintessential tools for simplifying the complexity of multivariate datasets. In dealing with data that has many variables, researchers and analysts often encounter challenges due to the intertwined nature of the observations. Variables can be correlated with one another, and parsing out the most influential factors becomes cumbersome.
This statistical method operates by identifying new axes onto which the original data can be projected. The first principal component is the direction along which the dataset shows the largest spread or variation. It captures the essence of the data’s variability and, in a sense, holds the key to understanding the heart of the dataset’s structure. Subsequent principal components are identified in the same manner, with the constraint that they must be orthogonal, or at right angles, to the preceding components.
 The practicality of PCA hinges upon covariance. Imagine plotting a multidimensional space where each dimension corresponds to a variable in the dataset. The covariance between any pair of variables then gives insight into whether increases in one variable generally correspond to increases or decreases in another, illuminating patterns of variability across the multidimensional landscape. If variables tend to vary together, PCA uses this covariance to help identify the directions in which the data can be compressed without losing substantial information.
Computing the covariance matrix of the dataset is just the starting point. From this matrix, PCA involves calculating the eigenvalues and their corresponding eigenvectors. Eigenvalues represent the magnitude of the principal components, with larger eigenvalues correlating with axes that account for a greater share of the data’s variability. Eigenvectors, on the other hand, are the specific directions for the principal components within the data space. By ranking eigenvalues from largest to smallest, PCA effectively orders the principal components from most significant to least.
Visualization is an integral part of the PCA process. It allows the transformation of high-dimensional data into two or three principal components that can be graphically displayed. What may be a dense cloud of points in many dimensions often translates into clearer patterns and even clusters when viewed through the PCA lens. This visualization can identify outliers, indicate clusters of similar observations, or suggest an intrinsic lower-dimensional structure within the data—such as a trend or plane along which the observations lie.
In a more advanced discussion, an essential matrix within PCA is the factor loading matrix. This matrix, comprised of eigenvectors scaled by the square root of their corresponding eigenvalues, conveys how much weight each original variable has in forming the principal components. Analysts can interpret these weights to understand the character and influence of the original variables in terms of the newly determined principal components.
PCA provides a mathematical route for reducing dimensionality while preserving as much variability as possible. The actual implementation of PCA in computational tools often involves singular value decomposition (SVD), an algebraic method that can decompose a dataset into its principal components more efficiently, especially for larger datasets. The outcome of PCA, specifically the principal components, then serves as an invaluable resource, facilitating further statistical analyses, such as regression models, where they can act as predictors devoid of multicollinearity, or in classification tasks where they serve to outline the separability between different classes with greater clarity.
Why Principal Component Analysis is Important
One of the most compelling reasons for PCA’s widespread usage is its ability to address the curse of dimensionality. As datasets grow in complexity with many features, it becomes significantly harder for algorithms to operate efficiently. More features not only require more computation power but also increase the risk of overfitting—where models perform well on training data but fail to generalize to new, unseen data.
Another aspect of PCA that underlines its importance is the concept of noise reduction. In real-world data, some variation is often due to the underlying signal (useful information) you want to capture, but some are simply noise. Noise can obscure patterns and make models perform worse because they may mistakenly treat random fluctuations as interesting structures. PCA can alleviate this by emphasizing the variation that has the largest impact on the dataset’s structure and filtering out those minor variations—often reducing noise in the process.
PCA also fundamentally changes the terrain of data visualization to create informative, low-dimensional views of high-dimensional problems. Data with numerous variables are not amenable to visualization, which can effectively display at most three dimensions for the human eye to discern. By projecting data into a lower-dimensional space with preserved variance, PCA allows for meaningful visual inspection. Visualization of PCA-transformed data can yield insights into grouping, separation, and clustering, which otherwise would remain concealed in the full dimensionality.
The importance of PCA extends to exploratory data analyses. Analysts often employ PCA at the onset of their examination to gain an initial understanding of their data. This initial ‘look’ with PCA can dictate subsequent steps by revealing hidden structures, suggesting the presence of clusters, or pointing to anomalies and outliers that merit further investigation. In other words, PCA often serves as a starting point that guides the deeper exploratory journey.
 PCA proffers a tangible computational advantage. High-dimensional data is demanding on computer memory and processing power. By distilling data into principal components, PCA can significantly reduce the computational burden, ensuring faster processing times and lower resource consumption, which is of utmost relevance in the age of high-throughput data processing and analysis.
The importance of PCA is also reflected in its influence over other multivariate techniques. By providing a means to remove multicollinearity from predictors, PCA enhances the performance and interpretability of regression models. In classification problems, the lower-dimensional space it creates facilitates the discrimination between different classes by making it easier to separate them with a simpler model.
Applying Principal Component Analysis
The implementation of PCA involves a series of steps. First, one must standardize the data if the variables are measured on different scales, as this ensures that each feature contributes equally to the result. Next, the covariance matrix of the standardized data is computed to understand how the variables interact with each other. The subsequent step entails the calculation of eigenvalues and eigenvectors of this covariance matrix. These eigenvalues and eigenvectors are crucial as they dictate the principal components and their relative importance.
The eigenvalues essentially represent the amount of variance that each principal component holds. By sorting the eigenvalues in descending order along with their corresponding eigenvectors, one can rank the principal components according to their significance. Typically, only the first few principal components are selected as they account for most of the variation in the dataset.
Once the principal components are determined, the original data can be projected into this new subspace. This process referred to as the PCA transformation, results in a new data set with reduced dimensions, where the first principal component corresponds to the direction of maximum variability, the second principal component captures the next highest variance and is orthogonal to the first, and so on.
The Significance of PCA in Machine Learning
In machine learning, PCA is a valuable tool for feature extraction and data pre-processing. By condensing the information contained in many variables into just a few principal components, we can expedite training processes, improve predictive accuracy, and prevent models from becoming overwhelmed by the volume and complexity of the data.
PCA is also particularly useful in exploratory data analysis (EDA). It provides a clear picture of the underlying structure of the data, revealing patterns and relationships that might not be apparent from the raw, high-dimensional dataset.
While PCA is a powerful and versatile technique, it is not universally applicable. One limitation is its assumption of linearity, meaning that it assumes that the data distributions are linear. PCA may not be effective for datasets with complex, nonlinear relationships. PCA is sensitive to outliers which can skew the principal components and misrepresent the true variation.
PCA is based on the variance of the variables, which implies that it emphasizes the variables with higher variances, potentially overlooking important variables that may have smaller variances.
